BE Computer (2012 Course)
Semester-2 Elective-4(a)
Business analytics and intelligence
Time: 1 hour Marks: 30
Q.1) a) What is Business Intelligence? Explain the architecture of it? (4 marks)
1) BI is about delivering relevant and reliable information to the right people at the right time with the goal of achieving better decisions faster.
2) Bi takes a large amount of data and represents it in a meaningful way. BI includes performance management, analytics, data and text mining.
3) For e.g. when you go to the mall and you want to buy some food. You need not find where food is located if it has a proper sign of that. Signs are used to navigating user. Now imagine the different items in the mall are your different set of business data. Suppose you need data about sales then BI will help you to provide this data. BI takes large information of business and convert it into such mall store and navigate you through all information so that the information is easily accessible to you without relying on another.
Q1) b) Define and differentiate between operational data and transactional data? (4 marks)
1) Transactional data is collected for each incident occur in the system and the operational data is a data that support the entire operation.
2) Imagine you are shopping on Flipkart and for each item you buy online through your card you have to make the transaction, this will be considered as transactional data. The whole system of items that are available for sale and all others which make a whole system is considered as operational data.
Q1) c) Define the terms: (2 marks)
- Information
- Knowledge
Information:
- Information is anything that is communicated. Information itself is a data that handled in a way which looks meaningful to others who get it.
- For example, if your boss tells you details about how the sales of your company have decreased in previous 3 months then you can use this information for increasing your sales in upcoming months.
Knowledge:
- Knowledge can be defined as the information about the particular topic that you get either by studying that topic or by your past experience.
- It can be a combination of different facts and statements which are exits true.
OR
Q2) a) Explain how data analytics is beneficial, by considering the case study of an Educational Institute. (4 marks)
We are considering a case study of Nottingham Trent University which first introduced a student dashboard. For creating the dashboard, the three major factors are considered they are:
1) First, the university runs an HEA-funded project between 2008-2011 which focus on student involvement and their retention called HERE (higher education and retention).
2) Then they tested how feasible it will be to implement the learning analytics.
3) In the end, they conducted one audit which discovered that the institution is performing well on retention and the space for improvement was available for sharing data and using data to inform intervention.
4) The project detected that one-third of students left university during the first year and remaining are feeling distant from their tutors and peers. They found their courses less satisfying and are struggled to manage with their studies.
5) Based on all this data later university developed a dashboard to improve the student perception related to their course. In the dashboard, each student can log in and can compare themselves with their peers to see how they are doing with them. The dashboard records all the details such as the use of the library, e-books, log in to the virtual learning environment and attendance. The benefit of the dashboard is even more than it helps a student in their studies analysis and what they need to do to be more engaged as compared to their peers.
6) As a result of this, the strong connection is made between high engagement, high retention and high academic performance which at the end benefit the students.
Q2) b) Define Business Intelligence cycle and explain its various stages with suitable diagrams. (4 marks)
The Business Intelligence cycle contains 5 main components.
- Requirements Gathering and Planning
- Analysis
- Gain Insight
- Decision Making
- Evaluation

Let discuss one by one in detail:
- Requirements Gathering and Planning:
It is the first step in the Business Intelligence cycle where entire requirement gathering is done. On the basis of that requirement, the category of the project is decided. The data we get in this phase helps in determining the execution of business Intelligence project. Planning of BI project includes which components we are going to be used for development of our business intelligence project.
- Analysis: Analysis of Business intelligence projects problems is important with the analysis of tools and frameworks that are useful in the development of the project. Also, the analysis of return on investment (ROI) and estimation of cost-benefit ratio is done here.
- Gain Insight: The information that acquired in the previous phase is helpful here. This step helps in the understanding of the problem in depth. The identification of risk in the BI project is done here. Here the cause of the problem is analyzed in detail and required actions are determined.
- Decision making: By using BI tools and technologies, the execution of the analysis phase and insights phases is done so that accurate decision can be made which will be beneficial for business enterprises. This befits in less execution time for analysis and insight phase which help in a better decision-making process.
- Evaluation: This is the last phase of Business Intelligence cycle which helps in performance determination. Comprehensive measures are mapped which can be taken as a performance index.
Q2) c) List any two standard business in intelligence tools popular in the market. (2 marks)
The RDBMS and ETL Tools along with all other popular tools available are used in BI.
1) RDBMS:
- Netezza: Netezza is developed to decrease the query times and hasten it. It provides a quick and nearly correct answer to the complex business questions.
- DB2 Connector: The main function of the DB2 connector is to provide connectivity and metadata integration for other data sources which can be relation database etc.
- Sybase IQ: It is column based and relational database system specifically used in business intelligence as well as in data warehouse.
2) ETL Tools:
- Informatica: It is used for abstraction of data from sources then loading into the target storage. It makes easy to develop the data warehouses as well as data marts.
- Data Stage: It contains the collection of windows based graphical tools that are very helpful in the construction of ETL tools. This tool also makes a connection to the DataStage server and help in the managing of metadata associated with it.
- Ab inito: It has the good graphical user interface which is based on parallel processing tool that used for ETL data management and its analysis. It provides high data potency.
- SAS: It mainly provides multithreaded and multiprocessing data extraction that reduces the time for operations and data transfer. It also eliminates the less accurate data that reduce the overall cost.
Q3) a) Explain component of decision support system (DSS). (4 marks)
The Decision support system contains components such as the database, repository of mathematical model and module for handling the communication between the system and user. Later new components are added into DSS which are Data management, Model management, Interactions, Knowledge management.
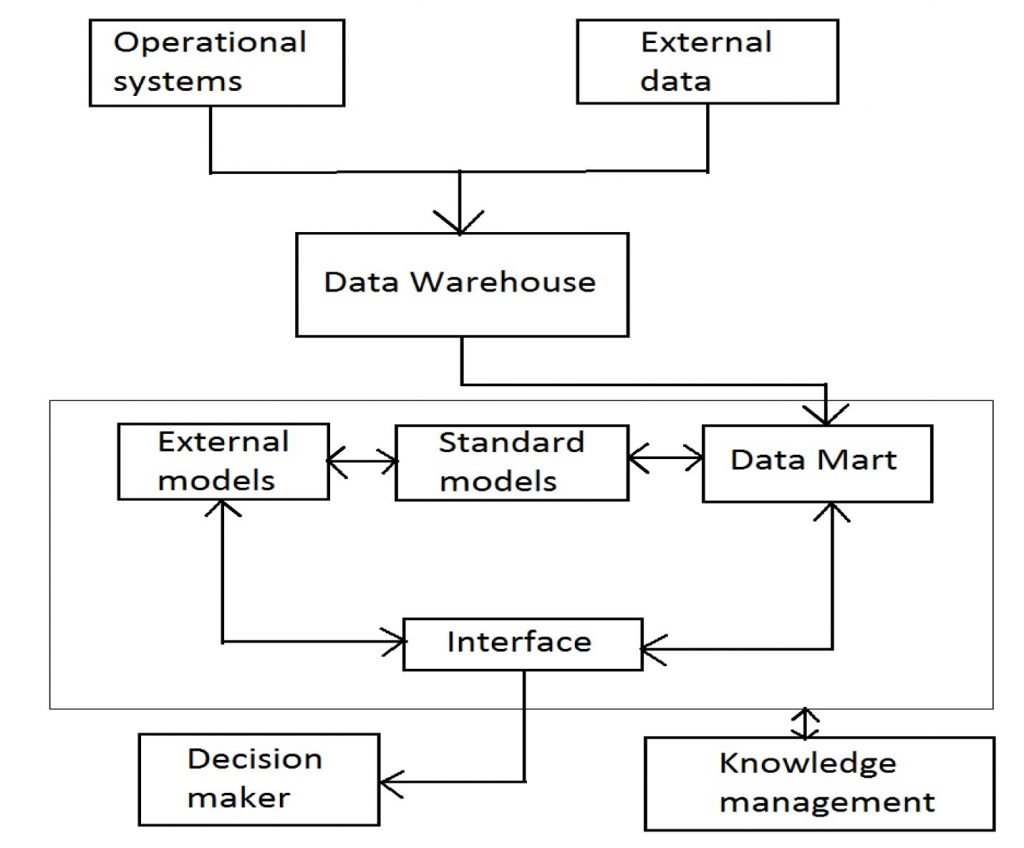
Let discuss this in detail:
- Data Management: In this, the data management module is linked with the data warehouse that corresponds to the central data warehouse storage. Data management module contains database and many times data mart act as a database.
- Model management: Model management module contains set of mathematical models. It is a simple model and very useful in the decision-making process. It can be integrated with more complex external models. It helps the knowledge workers for the evolution of ad-hoc models.
- Interaction: The module which is responsible for the interaction takes its input from users during the graphical user interface of web browser and returns the mined data with knowledge prepared by a system.
- Knowledge management: This module allows the decision makers to show different shared knowledge and it is interdependent to the knowledge management integral system.
Q3) b) Mention three main types of analysis which can be performed using any DSS system. (4 marks)
Three core analyses which can be performed with the help of DSS are
1) Strategic
2) Tactical
3) Operational
1) Strategic: It is very helpful for the newly launched product to make its place in the market. It also benefits to see the long-term view in business. It also maintains different information such as its sale and cost etc.
2) Tactical: There are various tools which can be used for reducing the cost of the product with developing its productivity. It maintains the information about sales, expenses etc. Thus, it helps in developing beneficial operations.
3) Operational: It has all the information about the employee, total orders, and supplies with the production data. It needs to analysis the everyday activities of running the organization.
Q3) c) What forms the backbone of the decision-making process. (2 marks)
Decision support system is a set of hardware and software applications which forms the backbone of one’s decision-making process. It helps to make perfect decisions. Decision support system supports the decision making. This system can be used by one user or many users. It is location independent which means it is accessible from multiple locations. It is very beneficial for decision makers.
OR
Q4) a) Explain the role of BI in decision support system. (4 marks)
1) Business intelligence system helps in analysis of business data. It provides relevant and reliable information with the goal of achieving better decisions faster. So they can be considered as decision support system.
2) Business intelligence system uses many technologies for the purpose of decision making which are OLAP (On-line analytical processing) and data warehouse (which have the main role of storing the data related to business such as sales data, product supply data etc.).
3) The Business intelligence system tools are very helpful in the management of the business process. It acts as a support for one’s decision making. BI helps for better decision making by serving business enterprises.
4) In BI most important part is designing and making the data warehouse for storage and analysis of data for better decision making in business. Thus BI gets more attraction of organization than any other factors present in decision support system.
Q4) b) Explain techniques of decision support system? (4 marks)
Decision Support System techniques are:
1)Data mining techniques which include genetic algorithms, neural networks, regression algorithms, machine learning, decision trees, regression algorithms, clustering analysis.
Data mining can be defined as the extraction of meaningful data from a large amount of raw data. In data mining, the data patterns are recognized. By using data mining, businesses are able to observe more about their customers and can create more effective strategies regarding various business functions.
Clustering Analysis:
We can define clustering as it is a process of dividing a set of data into different subsets. Each subset is called a cluster. Similar types of data having similar characteristic gather together and form a set of data, this kind of analysis is used in clustering. By using such analysis different clusters are formed.
Regression Algorithms:
It is an analysis tool in which the classification is done through logical and forecasted reports. In linear regression non-linear data is converted into linear data. It has multiple applications for solving business problems.
Decision Trees:
Decision tresses are known as joining rules. In decision trees, a decision represents rules where tree represents structure. By gathering all variables the trees are created which helps while making the decision and results are estimated accordingly.
Neural Networks:
The neural networks are based on the concept of neurons of the human brain. It is structured in three individual layers. The first layer consists of an entry for each data for each node, because of the hidden characteristic of the second layer it adds complexity to the system while the last layer represents the result of an operation on data.
Q4) c) what are main limitations of DSS? (2 marks)
There are 7 limitations of decision support system
- The assumption of Relevance: If Decision Support System become common in organizations, then there is a chance that managers of organization can use them inappropriately. Providing proper Training to the managers is the solution to this problem.
- The false belief in objectivity: It is an overstatement that people who are using DSS are more objective and rational than managers who are not using computerized decision support.
- Information overload: The excessive information load can also be a problem is DSS system.
- Overemphasize decision making: Implementing DSS can reinforce rational view and overemphasize decision processes and decision making.
- Status reduction: Managers worries about the status reduction of the organization so they prefer clerical work.
- Transfer of power: This is more a related with decision automation systems as compared to Decision Support System. It advocates building computerized DSS.
- Unanticipated effects: Some Decision Support System reduces the skill required for taking a decision as well as some might overload decision-makers with data and decrease the effectiveness of decision making.
- The false belief in objectivity: Managers may not be more focus though they are using DSS. It is an exaggeration that people who are using DSS are more objective as well as rational as compared to managers who are not using computerized decision support.
Q5) a) Differentiate between star schema and snowflake schema with suitable example? (4 marks)
The difference between star schema and snowflake schema is as follows:
| Sr.No. | Star Schema | Snowflake Schema |
| 1) | It is easy to understand. | It is difficult to understand. |
| 2) | It supports the top-down approach of the data model. | It supports the bottom-up approach of the data model. |
| 3) | It provides more redundancy. | It provides less redundancy. |
| 4) | It does not support normalization. | It supports normalization. |
| 5) | It is flexible. | It is less flexible than star schema. |
| 6) | Response time is less. | Response time is high. |
| 7) | It contains less number of joins. | It contains the number of joins. |
| 8) | Provide high efficiency. | Provides less efficiency. |
| 9) | It is preferred to use. | It is used fewer times. |
Q5) b) Explain materialized view and snapshot materialized view with suitable example. (4 marks)
Materialized view:
1) It stores the copy of all summarized table data in rows and column format. Hence performance is increased.
2) The aggregate data of materializing view is stored in the data warehouse which results in the elimination of overhead of queries.
3) Materialized view performs different roles to improve the performance of a query which reduces the duplication of data. Materialized view in all databases though it is not supported in MySQL and Postgre SQL we can create it by using triggers.
4) Application of materialized view is mobile computing.
Example: By applying materialized view to employee table we get details of employee ID and their names.

Fig. Materialized View Example
In the above figure, the first table is the employee table then materialized view of employee table is created below with Employee_ID and Employee_Name
Snapshot Materialized View:
1) Snapshot materialized view: we can say materialized view is snapshot materialized view if the table created resides outside the database.
2) Data is stored in remote tables known as snapshots.
3) Snapshot and materialized view are almost same but with one difference. You can say that materialized view = snapshot + query rewrite functionality. We can enable or disable query rewrite functionality.
4) Materialized view resides in the same database as table 1 as shown in the figure.
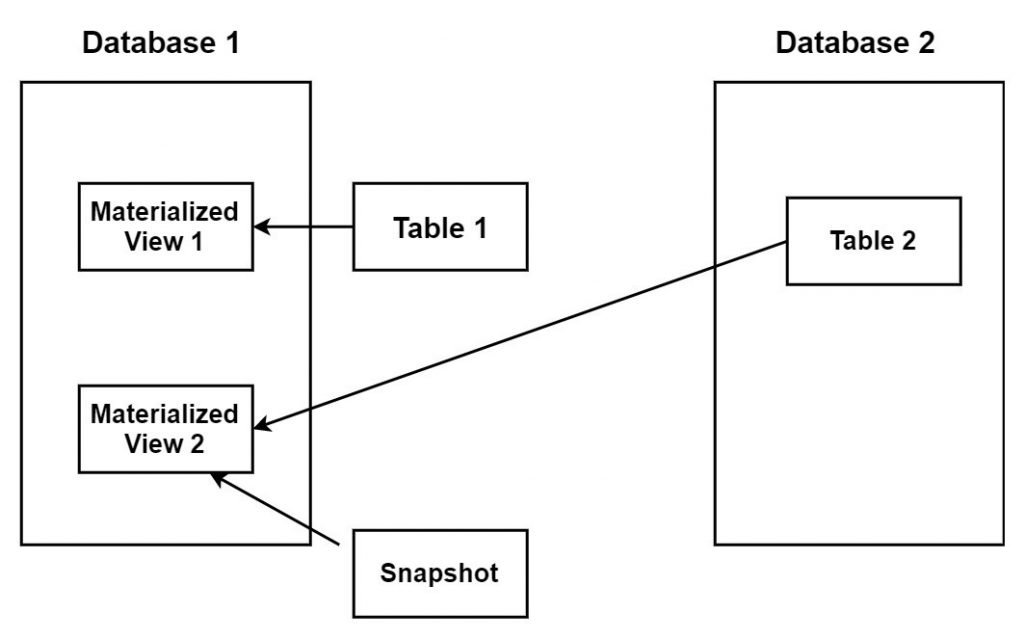
Fig. Snapshot Materialized View
Q5) c) Name four main characters of the data warehouse. (2 marks)
Ans: Data warehouse contains the collection of data that is used for decision making and business intelligence. The main characteristics of the data warehouse are:
- Subject Oriented:
A subject-oriented data warehouse is applicable to a particular subject area. For example, sales can be a particular subject area. It helps the user to know more about working of their business.
- Integrated:
Data warehouse incorporates the data from different data origin. We can take an example as, for different data source there may be a different way of identifying a particular product but this not happens in the data warehouse. In a data warehouse, there is only one way to identify the particular product.
- Time-variant:
The data in data warehouse comes daily, weekly, monthly or quarterly. This data is time variant. Continuously coming data get the store in the database while the past data is used for processing, finding patterns etc. By analyzing data in data warehouse, it can help to take better decision while decision making.
- Non-updatable: Once data entered into the data warehouse, we cannot alter the data.
OR
Q6) a) Explain data warehouse architecture and its components with suitable diagram. (4 marks)
The business requirements are gathered from the user and according to that the data warehouse architecture is built.

Fig. Architecture of data warehouse
The four main layer of data warehouse architecture are:
1) Operational Data Source Layer
2) Data Staging Layer
3) Data Presentation Layer
4) Data Access Tools Layer
- Operational Data Source Layer
It is top layer in data warehouse architecture. This layer contains sources through which raw data comes from. The different sources are operational data, third party data or weblogs. The main source of data among all is OLTP(Online transaction processing) System. The data may be in a different format such as flat files, text files, excel files, RDBMS etc.
- Data Staging Layer
Data need to be processed before storing into the database. The set of ETL process extract data from external sources then that data is stored, cleansed, transformed in the staging area to load into the data warehouse. In the data extraction operation, first, it read the data then understands it and then extract it from its data source. Then at transformation stage, a set of rules and regulation are applied to that data before storing into the data warehouse. After transformation, a data is loaded and stored in tables.
- Data Presentation layer:
Data presentation layer is responsible for showing the information to the user through the browser or an email report. OLAP tool is used by data presentation layer for this operation.
- Data Access Tools Layer:
The data access layer contains data which may be in a different format such as graphs and tabular format which is available to the user. The data access tools are analysis tools, reporting tool, and data mining tool.
Q6) b) With suitable schema, design a data warehouse data model for clinical data (for example. Drugs, patients, Physicians etc.). (4 marks)
- Star schema is used for the dimensional modeling of the data warehouse. In a star schema, all the dimensions are linked to central fact table by using the key.
- Star schema implements one too many relationships between fact and dimension table.
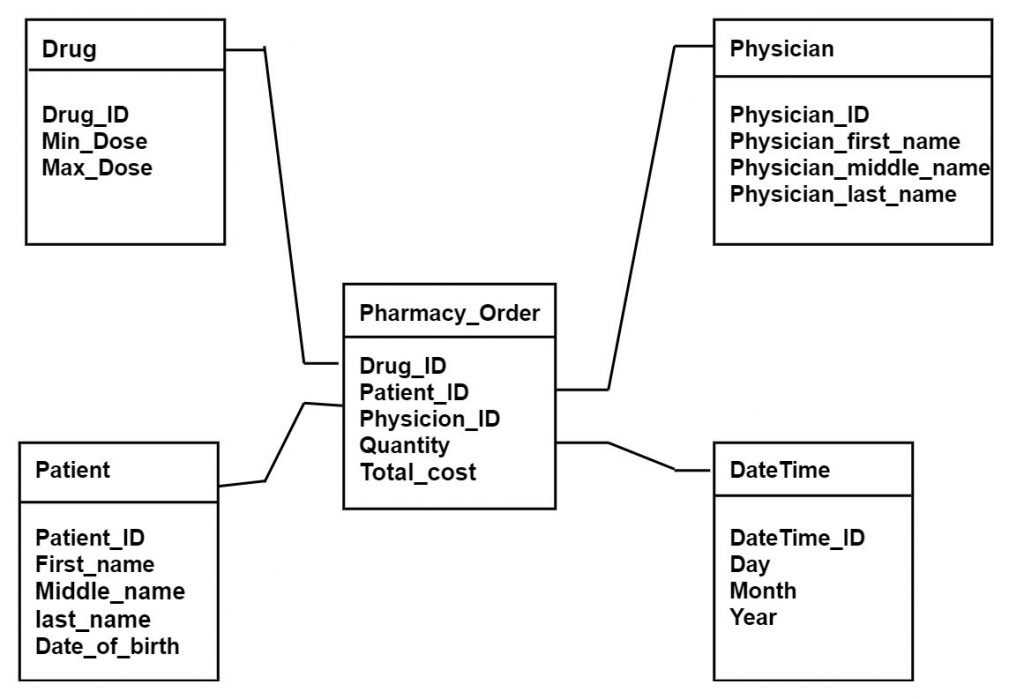
Fig. Star schema for Clinical Data
- Pharmacy order is a central fact table in star schema to which all four dimensions having their own attributes are connected. The fact table also contains unit cost, quantity, and total cost measures. The four dimensions are DateTime, patient, drug, Physician.
Q6) c) Define the following terms in data warehouse modeling with an example. (2 marks)
- Fact Table
- Dimension table
- Fact Table :
1) A fact table is a central table in a star schema. Fact table stores quantitative information for analysis and it is denormalized.
2) A fact table works with dimension tables. Every event is recorded in the fact table. Thus, as time increases the number of records in fact table is also increased.
3) A fact table holds the data to be analyzed and a dimension table stores data about the ways in which the data in the fact table can be analyzed.
- Dimension Table
1) A dimension table is a table in a star schema of a data warehouse. A dimension table stores attributes or parameters that describe the objects in a fact table.
2) A unique key called as the surrogate key is generated to identify a row in the dimension table.
3) Dimensions categorize and describe data warehouse facts as well as measures in a particular way that give meaningful answers to most of the business questions.


Very halpful for me,thx